 Let the Data Speak About Activation Energy
There are many factors to consider when conducting an analysis of accelerated test data. One factor that is often overlooked or misrepresented is the activation energy. When considering accelerated life tests, the activation energy represents the magnitude of effect that the applied stress will have on the product under test. A large activation energy indicates that the applied stress will have a large effect on the life of the product. Understanding activation energy is one thing, but obtaining an accurate value is another. Currently, the published values of activation energy relate to a particular material, technology, or failure mode, but how this value relates to a product, which may be composed of many different materials, is unknown.
One possible method to alleviate the problem of selecting the most representative activation energy is to estimate the value based on collected data. Utilizing maximum likelihood theory, the parameters of the Arrhenius model are solved while using the Weibull distribution as the underlying life distribution. Once the parameters have been estimated, the activation energy and acceleration factor can be easily calculated.
相关文章:Arrhenius模型在ALT中的应用案例 链接
#p#分页标题#e#
Arrhenius Relation
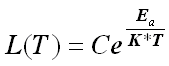
The Arrhenius life-stress relationship is given by:
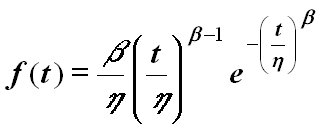
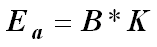
where C is a parameter to be estimated, Ea is the activation energy and K is Boltzman’s constant (8.617385*10-5 eV/K). The 2-parameter Weibull pdf is given by:
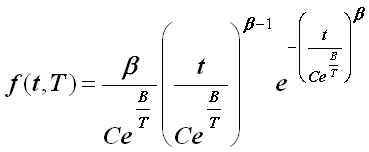
The scale parameter (characteristic life) is h. The Arrhenius-Weibull pdf is obtained by setting h = L(T).
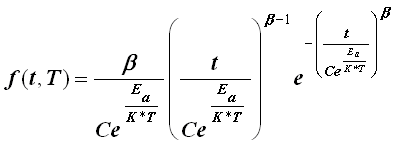
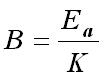
However, the activation energy, Ea, must be known a priori and this is rarely the case. So another parameter, B, is introduced, where:
The Arrhenius-Weibull pdf can be rewritten as:
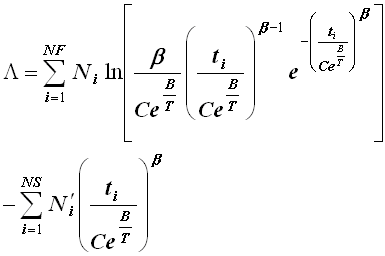
The parameters that need to be estimated are b, B and C. These parameters can be estimated using Maximum Likelihood Estimation (MLE) where the Arrhenius-Weibull log-likelihood equation is:
Once the parameters have been estimated, then the activation energy can be calculated using the following equation:
Significance of B
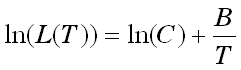
The significance of the parameter B can be seen if the life-stress relationship is linearized by taking the natural logarithm of both sides. Therefore:
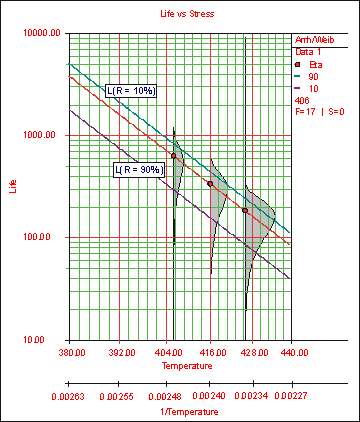
In the above equation, ln(C) is equal to the intercept, the inverse of the stress (temperature) is the variable, and B is the slope of the line. But B is not the slope of the life versus stress; it is the slope of the life versus the inverse of the stress. An example of a life vs. stress plot, also referred to as an Arrhenius plot, is shown in Figure 1.
Figure 1: Life vs. Stress Plot
It would seem from Figure 1 that B, and therefore the activation energy, is negative. This is due to the fact that the x-axis is actually a reciprocal scale. The x-axis is plotted on a reciprocal scale simply for practical purposes. It is just easier to read the life at 404 than at 0.00248 (the reciprocal of 404). Figure 1 actually illustrates that B is positive. As the reciprocal of the stress increases, the stress decreases. If the activation energy is small, then you can expect the life of the product to change slowly as the temperature changes.#p#分页标题#e#
Acceleration Factor
Once the activation energy has been estimated, the acceleration factor can be determined next. The acceleration factor is most often referred to as the ratio of the life between use stress level and some higher (accelerated) test stress level, or:
If the activation energy is known a priori (rarely the case), then the acceleration factor can be written as:
But since the parameter B is being estimated based on the given accelerated test data, the above equation can become:
From this equation, it is possible to estimate the value of the acceleration factor based on the estimated parameter B (which includes the activation energy), as opposed to assuming a value for the activation energy. It can also be seen that the AF depends only on the Ea or B. Therefore, an incorrect assumption on either of these values will have a large effect on the value for acceleration factor.
Example
To illustrate the process of estimating the activation energy, 399 hard drive systems were thermally stressed at 308K and 328K for 1032 hours and three failures were observed. The collected data set is shown in Table 1, where "F" indicates that the observation has failed and "S" indicates a right censored (suspended) observation.
|
Number in
Group
|
F or S
|
Time
(hrs)
|
Temperature
(K)
|
| 1 |
F |
48 |
308 |
| 1 |
S |
60 |
308 |
| 197 |
S |
1032 |
308 |
| 1 |
S |
13 |
328 |
| 1 |
F |
16 |
328 |
| 1 |
S |
24 |
328 |
| 1 |
S |
38 |
328 |
| 1 |
S |
65 |
328 |
| 1 |
F |
73 |
328 |
| 1 |
S |
79 |
328 |
| 1 |
S |
98 |
328 |
| 1 |
S |
250 |
328 |
| 1 |
S |
361 |
328 |
| 190 |
S |
1032 |
328 |
Table 1: Accelerated Life Test Data
Arrhenius is selected as the life-stress relationship and Weibull as the underlying life distribution. It is also assumed that the use stress level is 308K. The parameters are estimated using ALTA 6:
b = 0.3074; B = 11674.2; C = 1.0506E-6
Therefore, the estimated value of the activation energy is equal to:
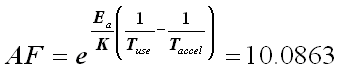
This is certainly a reasonable value and indicates that there is definitely some acceleration due to the temperature stress. Given Ea = 1.0060, Tuse = 308K and Taccel = 328K, the acceleration factor is estimated as follows:
Assuming an activation energy of 0.9, this would correspond to an acceleration factor equal to 7.906. The effects are obvious. A 10% change in the value of the activation energy resulted in more than a 20% change in the acceleration factor. Any incorrect assumptions regarding the activation energy could be detrimental to the analysis.


请登录之后再进行评论